Order Tracking Analysis
Product Overview
Order Tracking is a general term describing a collection of measurement functions used for analyzing the dynamic behavior of rotating or reciprocating machinery for which the rotational speed can change over time. Unlike the power spectrum and other frequency-domain analysis functions where the independent variable is frequency, Order Tracking functions present the data against multiples (Orders) of the variable shaft running speed.
The most useful measurements are Order Spectra and Order Tracks. An Order Spectrum displays the amplitude of the signal as a function of harmonic orders of the reference shaft’s rotation frequency. This means that a harmonic or sub-harmonic order component remains in the same analysis line (at the same horizontal position) regardless of the speed of the machine.
The technique that observes the changes of a measured quantity at a given order vs. RPM is called tracking, as the rotation frequency is being tracked and used for analysis. Most of the dynamic forces exciting a machine occur at multiples of the rotation frequency, so interpretation and diagnosis is greatly simplified by use of order analysis.
An Order Track is simply the history of measured amplitude at a single order versus the machine shaft speed (in RPM). There are other types of tracking functions. For example, you can track the FFT-based PSD spectra, a fixed band or an octave band versus RPM; all of these are tracking functions.
Capabilities of the Spider
The processing repertoire of Crystal Instruments’ Spider includes performing Order Tracking functions. With the CI Order Tracking package, the Spider can:
-
Measure and optionally record up to two (analog or digital) tachometer pulse signals simultaneously
-
Measure and optionally record 1 to 8 analog dynamic response signals simultaneously.
-
Process both tachometer signals to yield high fidelity RPM versus time speed signals (Tach Ch1 and Tach Ch 2) which can in turn be recorded.
-
Measure the constant frequency spectrum, also called as the FFT spectrum for up to 128 channels (requires multiple Spider modules).
-
Measure the Order Spectra for up to 128 channels
-
Measure the Order Tracks with phase for up to 128 channels (Can include multiple orders, including fractional orders for each channel). Measure the energy in fixed frequency bands vs. RPM for up to 128 channels
-
Applications
There are several different applications for order tracking. A discussion of some is given below.
The first application, often referred to as Run Up/Run Down, is used to survey a machine’s dynamic response when the operating RPM is varied across the entire operating span. In this case, the RPM range can be very large, from a few RPM to 10,000 RPM. Such tests are run on automotive or aircraft engines and when commissioning new or refurbished stationary processing equipment. The measurements can be any physical quantities such as sound, displacement, velocity, acceleration, torque, etc. The analysis measure can be the amplitude or the power of an order, the energy over a fixed frequency band, a bin of octave filter, etc. The most important result for this type of measurement is the magnitude of the response versus RPM.
The second application is monitoring measured machine displacement, velocity, acceleration, pressure, current or sound while the machine is performing its normal duty. The instrument measures the amplitudes of specific orders and their phase relative to a reference tachometer input signal. The phase is calculated relative to the tachometer input or a separate reference input. This application is common for machine diagnosis and balancing. In this case, the operating RPM is relatively stable. Order tracking technology is useful to increase the accuracy of the estimation of orders.
Order Track signals with phase are useful in the study of rotating machine during Run Up/Run Down. This is often presented as a “Bode Plot”, useful in characterizing resonance/excitation intersections. The Bode Plot is a concept borrowed from control theory; it provides simultaneous Amplitude and Phase data over a changing speed range (i.e. Run Up or Coast Down). Some of the setup information depends on the rate of change of the RPM. The Run Up or Coast Down could take anywhere from a few minutes to a few hours (such as for a cold startup on a turbine).
Understanding Order Tracking
Resolution and Span
In fixed-bandwidth operation, an analyzer collects N successive samples from an analog time-history at a sample rate, fs. The analog signal is pre-filtered by a low-pass anti-aliasing filter set to the desired analysis frequency range, Fspan and the sample rate is set to k Fspan, where k is a constant specific to the analyzer. Each captured time-history is transformed to yield a spectrum. The following spans and resolutions result:Dt = 1/fs= 1 / k Fspan time between adjacent time points (S)
Tspan = NDt duration of each time capture or memory load period (S)
DF = 1/Tspan difference between adjacent frequency points (Hz)
Fspan= NDF / k frequency range presented (Hz)
In order-normalized (order-tracked) analysis, both the frequency range and sample rate must vary in proportion to the machine speed. This is accomplished by measuring the shaft speed with a tachometer and deriving a sample rate equal to k Ospan times the instantaneous shaft speed. Ospan is the maximum number of shaft-speed orders (multiples) to be measured in a spectrum. The effective anti-aliasing filter must constantly adjust to limit the incoming signal bandwidth to Ospan times the shaft-turning frequency. This results in the following spans and resolutions:
DR = 1/fs= 1 / k O spanshaft-angle between adjacent signal samples (Revolution)
Rspan = NDR number of turns in each memory capture (Revolution)
DO = 1/Rspan difference between adjacent order points (Order)
Ospan= NDO / k order span presented (Order)
Typical analyzers require between 2.56 and 4 samples per maximum order spanned. This is the same k multiple relating the analyzer’s sample-rate to the frequency band studied in normal fixed-bandwidth analysis. The exact numeric value is determined by the analyzer’s design specifics.
Processing Concept
The vibration signal is sampled by an ADC that runs at a constant 102.4 kHz sample rate and is protected by a fixed-frequency anti-aliasing filter.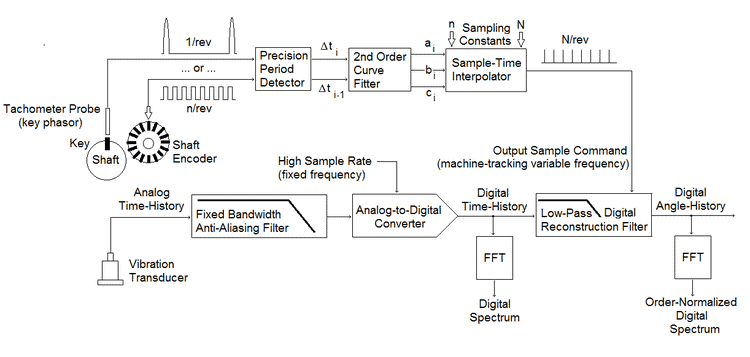
The bandwidth of this filter, Fspan, is selected such that,
Fspan>RPMmax x Ospan/ 60
where RPMmax is the maximum machine shaft speed to be analyzed and Ospan is the maximum order of shaft rotation to be analyzed. The sample-rate, fs, is set to a deliberately high value with regard to the input filter.
The resulting highly over-sampled digital time history is passed to the input memory of a digital reconstruction (amplitude-interpolation) filter. While this filter updates at the input sample rate, the output of this low-pass filter is sampled at a fixed number of times per shaft revolution.
These sample times are not uniformly spaced in time. Rather, each sample is taken at a time corresponding to a shaft rotation of DR from its predecessor. These fixed-angle sample times are computed from the successive periods of the tachometer signal.
The tachometer pulse train is applied to a precise timing circuit which measures the period between adjacent pulses. The two most recent periods are sent to curve-fitting and interpolation modules which compute the appropriate times at which to sample the interpolation filter’s output.
The sample times are computed based upon the assumption that the shaft experiences a constant angular acceleration between adjacent tachometer pulses. This real-time process accepts input (n) and output (N) pulse-per-revolution sampling constants, allowing the use of one or more equally spaced tachometer pulses per shaft rotation.
The resulting digital angle-history is presented for subsequent FFT and average processing. The interpolation filter introduces a processing delay between ADC input and the presentation of the angle-history. However, this delay affects all channels identically and the process proceeds in real-time without compromise.
After data re-sampling, a discrete Fourier transform (DFT) algorithm can convert the angle-history into the order domain. While many competitive systems employ “power-of-two” FFTs that restrict block size to be a binary number, Crystal Instruments utilizes a more flexible algorithm that allows this dimension to be a product of prime numbers (i.e. 1, 2, 5). This allows selecting “nice numbers” for resolution and span in all domains.
Frequency Response Function (FRF)
A common application of dynamic signal analyzers is the measurement...View Details
Octave Analysis and Sound Level Meter (SLM)
Acoustics measurements are performed for a variety of reasons, including:...View Details
Time Waveform Recording
While many manufacturers provide long term data recording functions on...View DetailsShock Response Spectrum Analysis
A Shock Response Spectrum (SRS) is a graphical presentation of...View Details
Automated Production Testing
Automated production testing is critical in today’s competitive manufacturing environment....View Details

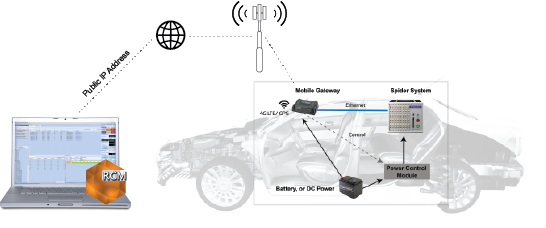
Remote Condition Monitoring Software
Remote Condition Monitoring (RCM) by Crystal Instruments is designed for...View Details
Vibration Visualization (DSA)
It is difficult to imagine the actual vibration level and...View Details
EDM Post Analyzer Software
The Post Analyzer application is used for the post processing...View Details
Precision Starts Here