
Shock Response Spectrum Analysis
Product Overview
A Shock Response Spectrum (SRS) is a graphical presentation of a transient acceleration pulse’s potential to damage a structure. It plots the peak acceleration responses of a bank of single degree-of-freedom (SDOF) spring, mass damper systems all experiencing the same base-excitation as if on a rigid massless base. Each SDOF system has a different natural frequency; they all have the same viscous damping factor. A spectrum results from plotting the peak accelerations (vertically) against the natural frequencies (horizontally).An SRS is generated from a shock waveform using the following process:
-
Specify a damping ratio for the SRS (5% is most common)
-
Use a digital filter to model an SDOF of frequency, fn and damping ξ.
-
Apply the transient as an input and calculate the response acceleration waveform.
-
Retain the peak positive and negative responses occurring during the pulse’s duration and afterward.
-
Select one of these extreme values and plot it as the spectrum amplitude at fn.
-
Repeat these steps for each (logarithmically spaced) fn desired.
The resulting plot of peak acceleration vs. spring-mass-damper system natural frequency is called a Shock Response Spectrum, or SRS.
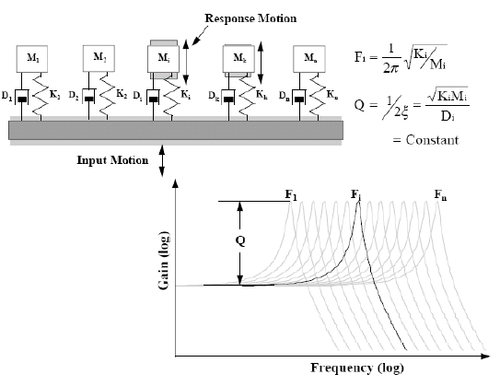
An SDOF mechanical system consists of the following components:
-
Mass, M
-
Spring, K
-
Damper, C
The natural frequency, Fn, and the critical damping factor, ξ , characterize a SDOF system, can be calculated from above parameters.
For a light damping ratio where ξ is less than or equal to 0.05, the peak value of the frequency response occurs in the immediate vicinity of fn and is given by the following equation, where Q is the quality factor, and equals to 1/(2ξ).
Any transient waveform can be presented as an SRS, but the relationship is not unique; many different transient waveforms can produce the same SRS. The SRS does not contain all of the information about the transient waveform from which it was created because it only tracks the peak instantaneous accelerations.
Different damping ratios produce different SRSs for the same shock waveform. Zero damping will produce a maximum response while high damping will produce a flatter SRS. The damping ratio is related to the “quality factor”, Q, which can also be thought of as transmissibility in the case of sinusoidal vibration. A damping ratio of 5% (ξ=0.05) results in a Q of 10. An SRS plot is incomplete if it doesn’t specify the document the damping factor (or Q).


Frequency Spacing of SRS Bins
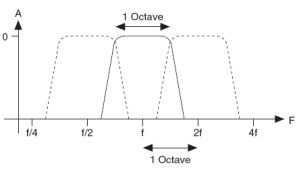
An SRS consists of multiple bins distributed evenly in the logarithmic frequency scale. The frequency distribution can be defined by two numbers: a reference frequency and the desired fractional octave spacing, such as 1/1, 1/3 or 1/6. (An octave is a doubling of frequency.) For example, frequencies of 250 Hz and 500 Hz are one octave apart, as are frequencies of 1 kHz and 2 kHz.
The proportional bandwidth display is very useful for analyzing a variety of natural systems such as the human response to noise and vibration. Many mechanical systems exhibit behavior that is best characterized by proportional bandwidth analysis.
To gain finer frequency resolution, the frequency range can be divided into proportional spacings that are a fraction of an octave. For example, with 1/3 octave spacing, there are 3 SDOF filters per octave. In general, for 1/N fraction octave, there are N band pass filters per octave.
Here 1/N is called the fractional octave number and the reference frequency is simply the lowest desired frequency, fc1. With the reference frequency and fractional octave number established, the frequency distribution over the whole frequency range is determined.
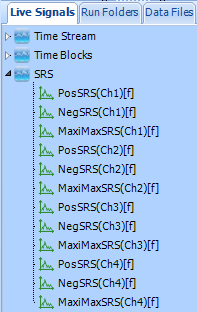
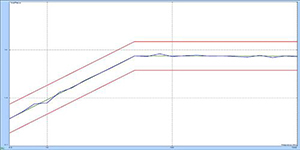
Measured Signals in SRS
The measurement quantities available to the Spider SRS test are: time stream of each channel (raw data), block captured time signals and three SRSs of each channel.
-
Time streams: this is the same as any other applications on the Spider. Time streams are always available for viewing and recording. It is a very useful tool for observing if the input signals are in the valid range or not. The recorded sine wave can also be used for further post-processing.
-
Block time signals: These are the block captured signals that are used for SRS analysis. Acquisition Mode will control how the block time signals are acquired.
-
SRS: Shock Response Spectra will be calculated for each block of time signals. The engineering units of the spectrum are determined by the sensor units specified for the input channel. The spectra are often denoted as three types: Maximum Positive spectrum; Maximum Negative spectrum and Maximum-Maximum spectrum.
-
Maximum Positive Spectrum: This is the largest positive response due to the transient input, without reference to the duration of the input.
-
Maximum Negative Spectrum: This is the largest negative response due to the transient input, without reference to the duration of the input.
-
Maximax Spectrum: this is the envelope of the absolute values of the positive and negative spectra. It is the most often used SRS data type. The log-log Maximax is the universally accepted format for SRS presentation.
-
SRS Analysis Parameters and Synthesis Parameters
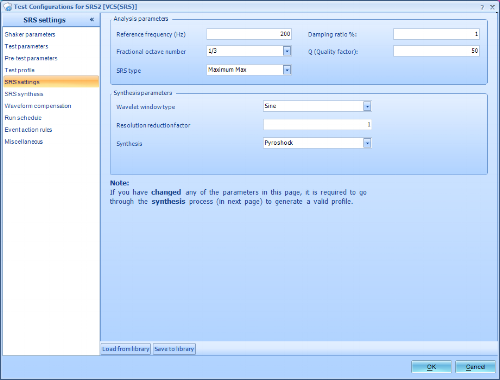
All of the SRS analysis test parameters can be found in Test Config->Analysis Parameters. FFT analysis parameters are defined in the same way as other FFT tests. SRS parameters include:
-
Reference Frequency: defines the reference frequency of the SRS spectrum.
-
SRS Type includes the Maximum Max, the Positive Max, and the Negative Max.
-
Fractional Octave Number is chosen from 1/1, 1/3, 1/6, 1/12, 1/24, 1/48.
-
Low Frequency: defines the lowest frequency boundary of the SRS spectrum.
-
High Frequency: defines the highest frequency boundary of the SRS spectrum.
-
Damping Ratio (%): defines the damping ratio as a percentage.
-
Q (Quality Factor) is a dimensionless parameter that describes how under-damped an oscillator or resonator is, or equivalently, characterizes a resonator’s bandwidth relative to its center frequency.
-
Wavelet Window Type is the windowing function available from Sine, Hann, Exponential, and Rectangular.
-
Synthesis has four available synthesis including Pyroshock, Minimum Acceleration, User Defined Duration, and Mil-Std810-F Standard.
-
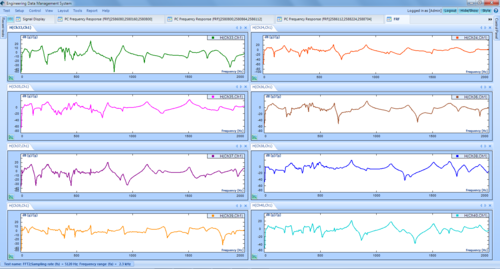
Frequency Response Function (FRF)
A common application of dynamic signal analyzers is the measurement...View Details
Octave Analysis and Sound Level Meter (SLM)
Acoustics measurements are performed for a variety of reasons, including:...View Details
Time Waveform Recording
While many manufacturers provide long term data recording functions on...View DetailsShock Response Spectrum Analysis
A Shock Response Spectrum (SRS) is a graphical presentation of...View Details
Automated Production Testing
Automated production testing is critical in today’s competitive manufacturing environment....View Details

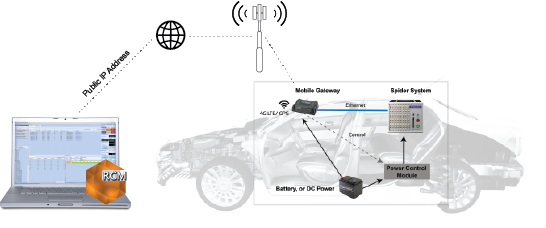
Remote Condition Monitoring Software
Remote Condition Monitoring (RCM) by Crystal Instruments is designed for...View Details
Vibration Visualization (DSA)
It is difficult to imagine the actual vibration level and...View Details
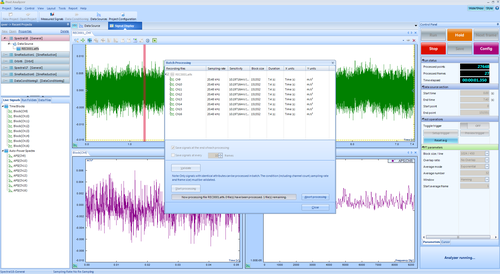
EDM Post Analyzer Software
The Post Analyzer application is used for the post processing...View Details
Precision Starts Here