Vibration Visualization (DSA)
Product Overview
It is difficult to imagine the actual vibration level and distribution from the numerical display or the signals which are basically a mathematical representation of the vibration experienced by the structure under test. Animating the structure’s deformation helps to get a better picture of the intensity of vibration. A contour scale which graphically displays the magnitude of vibration on the structure using a color plot helps in visualizing which areas of the test unit is experiencing maximum and minimum magnitude of the vibrations.

Configuration
A 3D geometry model of the structure under test is required to animate the vibration it is experiencing. It is tricky to create a 3D model of intricate geometries because of the complexity involved in measuring the x, y, z coordinates of the test article and using this information to generate a model with lines and surfaces.
The vibration visualization approach proposed by Crystal Instruments not only helps in overcoming the difficulty of producing 3D geometries of any complicated models with a simple procedure but also animates the structure’s deformation which makes it possible to visualize the vibration experienced by the testing article during a vibration test.
Additional Information
As illustrated in the diagram to the right, a series of 2-dimensional photos taken from a smartphone are used to construct a real 3-dimensional model of the object. The object is put under a vibration test, while the vibration can be visualized in real time using the real 3D model.
The vibration visualization of the 3D model can be performed in real-time while the measurement is ongoing. The real-time animation uses the point data of the input channels (sensors) to display the deformation of the test article during the vibration test.
There are three ways of generating a three-dimensional geometry model of the structure under test.
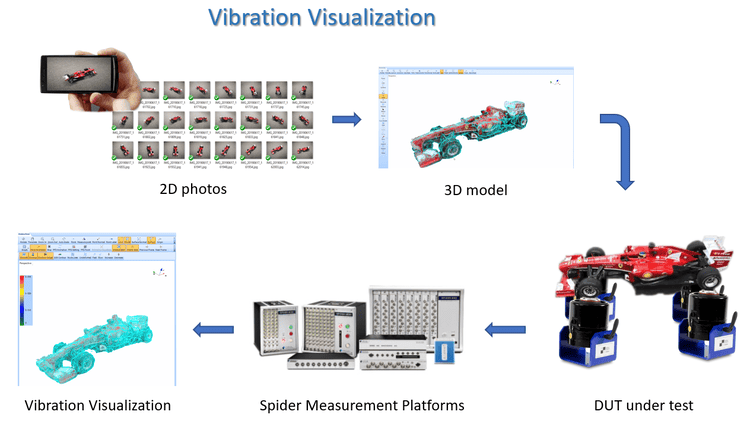
Figure 1 – An overview of the proposed Vibration Visualization procedure 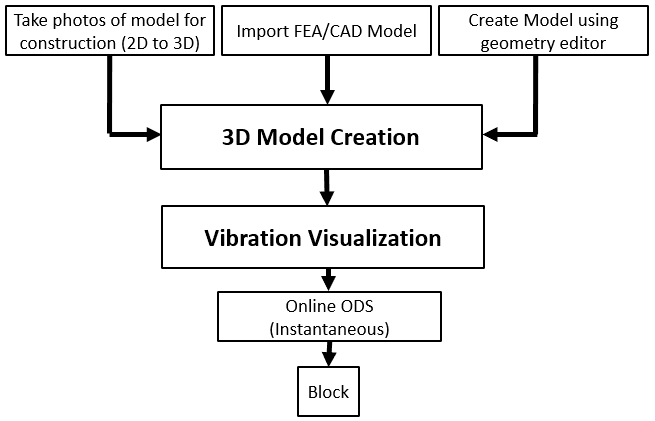
Figure 2 – A schematic flowchart of the Vibration Visualization process Crystal Instrument’s 3D Model Reconstruction software uses the advanced technology of 2D to 3D reconstruction to provide a simple solution to the intricacies of creating 3D geometric models of convoluted test structures. This approach not only saves the user time and effort but also provides an accurate model with great simplicity. The user simply takes photos of the test article and feeds it into the software. These images are matched to extract the features and a 3D model of the structure is constructed after the point and surface reconstruction processes. This method is extremely easy to use, does not require any manual labor and is much quicker than the other two approaches.
The following steps briefly explains the working principle behind the 2D to 3D reconstruction procedure.
- Capture photos
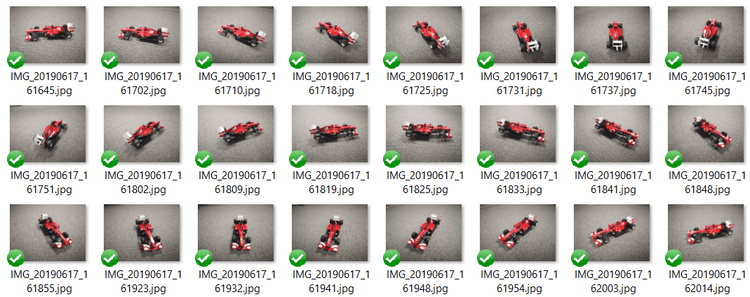
Figure 3 – Captured Images of the test structure The user takes 2D photos going around the testing object. The photos can be taken using a smartphone or a camera. To obtain an accurate 3D model it is suggested that the user takes photos at every 15 degrees which corresponds to approximately 24 photos of the test object. Increasing the number of photos will improve the accuracy of the model but may increase processing time.
- 2D to 3D reconstruction in Crystal Instrument’s 3D Model Reconstruction software
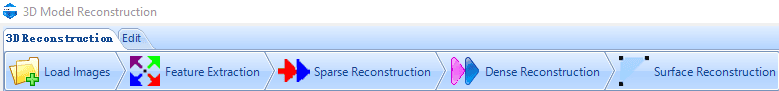
Figure 4 – A screenshot of the processes involved in 2D to 3D reconstruction procedure 1. Load Images
The 2D photos are imported into the reconstruction software to match the images and extract the features.
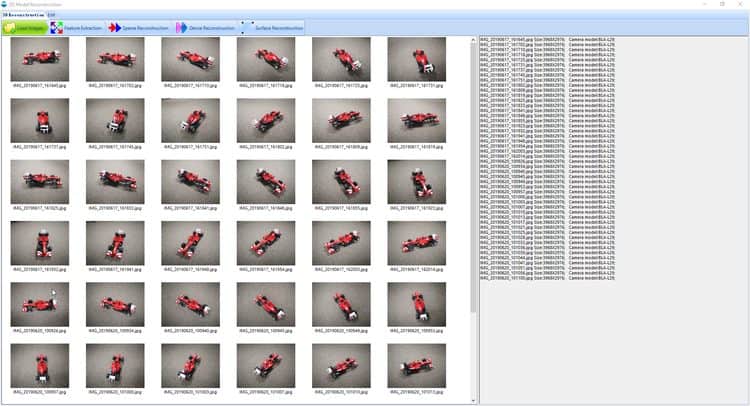
Figure 5 – Images loaded into the EDM 3D Reconstruction software 2. Feature Extraction
Based on the triangulation principle, two corresponding photos are used to determine the depth of the test object. The 15-degree interval helps in obtaining an optimal overlap between consecutive images which further improves the image matching.
The CCD width is determined by the number of pixels in the photo and the focal length of the camera. A higher number of pixels and larger CCD size implies a better resolution of the photo. The image scale basically implies if the photos are rescaled to complete the image matching process. The default match ratio of 0.6 should be enough to obtain a good match between the images. This is a suitable balance between good image matching and the fast feature extraction process.
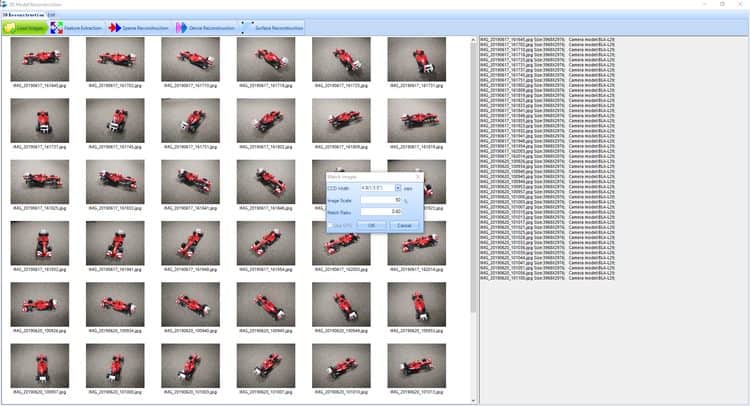
Figure 6 – Parameter setting for Feature Extraction process 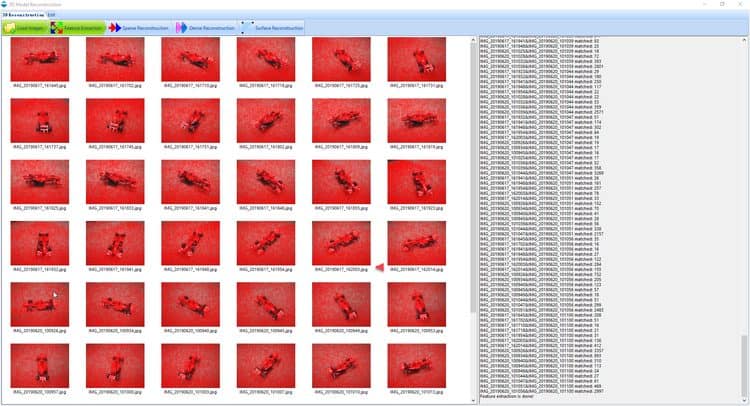
Figure 7 – A screenshot of the completed Feature Extraction process 3. Sparse and Dense Reconstruction
Detecting the key features from the images helps in creating a sparse point model of the test structure. This is a fast and rough model creation before the constructed point geometry is fine tuned in the dense point reconstruction procedure. The initial image pairs to begin the spare point model reconstruction can be automatically chosen by the software.
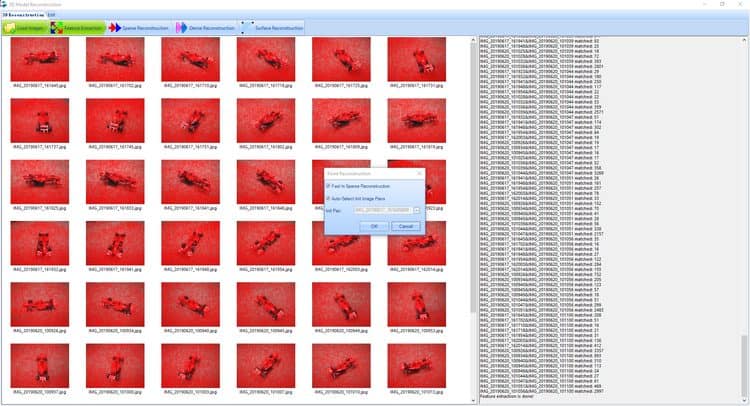
Figure 8 – Settings for Spare Reconstruction process More information from the feature extraction and sparse point reconstruction is used to generate a dense point 3D model.
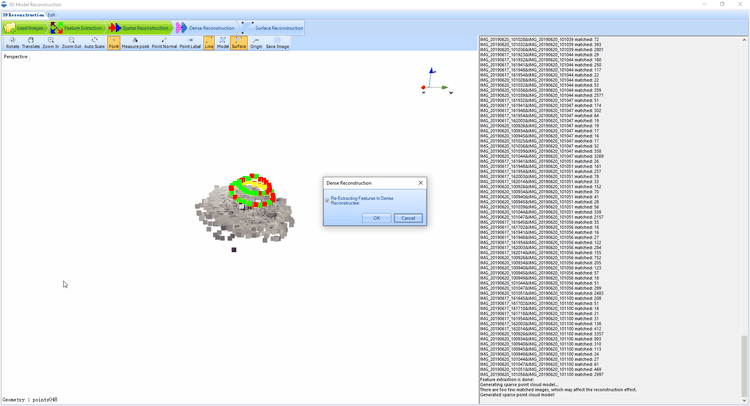
Figure 9 – Prompt for Dense Reconstruction process 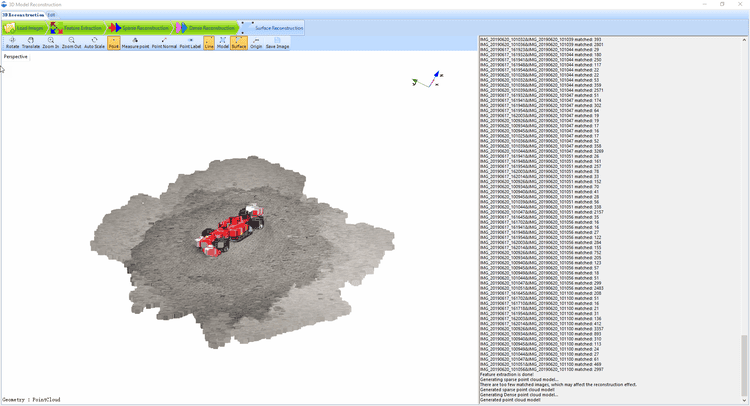
Figure 10 – A screenshot of the dense point constructed model -
4. Surface Reconstruction
A complete 3D model is produced in the surface reconstruction stage by automatically joining all the points in the penultimate dense point model.
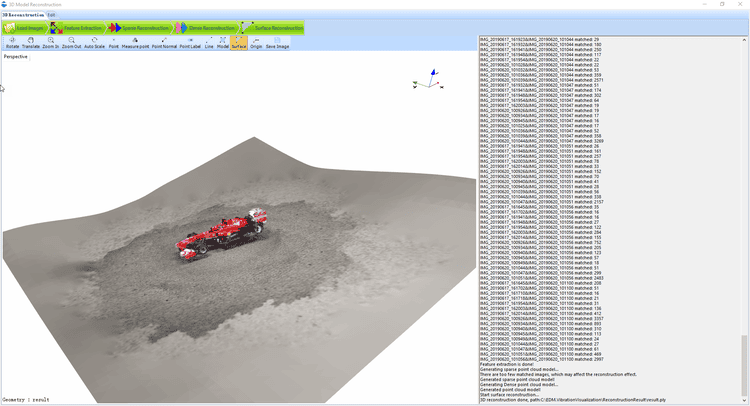
Figure 11 – A screenshot of the completed surface reconstruction process
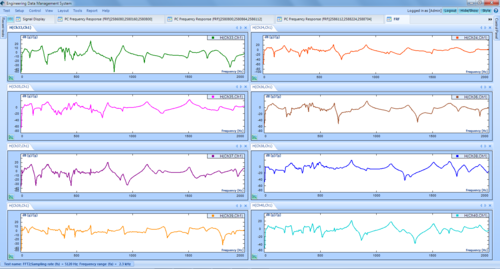
Frequency Response Function (FRF)
A common application of dynamic signal analyzers is the measurement...View Details
Octave Analysis and Sound Level Meter (SLM)
Acoustics measurements are performed for a variety of reasons, including:...View Details
Time Waveform Recording
While many manufacturers provide long term data recording functions on...View DetailsShock Response Spectrum Analysis
A Shock Response Spectrum (SRS) is a graphical presentation of...View Details
Automated Production Testing
Automated production testing is critical in today’s competitive manufacturing environment....View Details

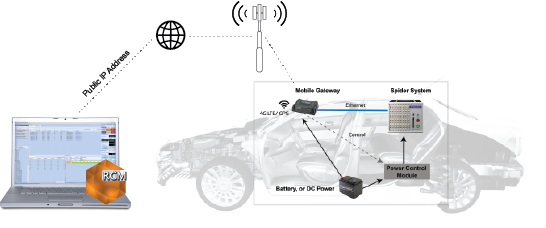
Remote Condition Monitoring Software
Remote Condition Monitoring (RCM) by Crystal Instruments is designed for...View Details
Vibration Visualization (DSA)
It is difficult to imagine the actual vibration level and...View Details
EDM Post Analyzer Software
The Post Analyzer application is used for the post processing...View Details
Precision Starts Here